

The devastating series of tornadoes, of which the F-5 (maximum intensity) event that hit Joplin, Missouri left in its wake over 130 dead was the most terrifying, raise the question if tornadoes are becoming more destructive and if 2011 is a record-breaking year. With over 500 people killed and more than 1200 tornadoes recorded by the end of May 2011 looks quite awful. Although the number of fatalities or tornado incidents is high, 2011 is not the most destructive of the last 60 years for which we have comparable meteorological data. With about 1000 tornadoes so far, 2011 is still short of the 1808 tornadoes recorded in 2008.
Furthermore, data published by the National Atlas indicates that the impact and severity of tornadoes have been decreasing since 1950. The current developments might be just a spike in a downward trend. Yet, it should also be said that the number of recorded tornadoes has increased over the same period, from 200 to over 1000. The reason for this increase is not very clear. It might be a sign of changing global climate patterns or the consequence of better tornado tracking technologies and reporting techniques. In other words, it is possible that we have more tornadoes today because we are looking for them with better glasses.

Update: Click on the image to see the Joplin tornado path interactively and in 3d
The chart below shows the average yearly severity of 50,000 tornadoes recorded between 1950-2008. The red line indicates the average F-scale value of tornadoes for each year. The scale goes from 0 to 5, where 5 represents complete devastation and 0 moderate effects. The chart shows that there has been a steady decline in average severity, from over 2 to anywhere between 0.5 to 1. The blue line uses a three-factor scale, which takes into account F-Scale, average area of devastation and number of casualties. Values are expressed in “standard” deviations from the entire period mean. Again, the last ten years, although a little over the mean, are under the spikes that characterized the 1950s and 1970s.

The total number of casualties has also been rather low in the last couple of decades, compared to the 1950-1975 period, when in some years up to 5000 people were hurt or died as a consequence of tornadoes.

Map: Counties most impacted by tornadoes (1950-2008)
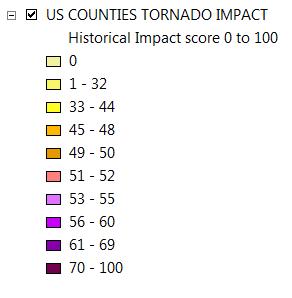
Using the same data I put together this map, which depicts how much was each county impacted by tornadoes over the past 60 years. The numbers reflect three factors (casualties, tornado intensity, and area of destruction) multiplied by the number of tornadoes that afflicted each county. (0 represents no impact and the higher the negative number, the lower the impact).
Find your own county on the map. Zoom in and match the color with the legend to the left.
You can also see the map of overtime tornado impact in 3d. Click “Earth” button in the upper right corner of the map.
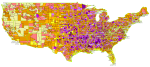 Alternately, you can view a clickable version of the map, which provides county-level data (impact factor, number of tornadoes and casualties). http://matei.org/url/146
The map of tornado overtime impact also reveals that the most affected areas are more likely to be in the Midwest and South than in the proverbial Kansas/Oklahoma tornado alley. 10 of the 20 most affected counties are in Southern states. Surprisingly, or not, one of the most affected counties, Worcester, MA is in the Northeast. The historic impact is a calculated score, as discussed above (Scale x fatality x area x number of tornadoes). 100 is the worst recorded impact (Archer, TX). Zero represents no impact at any point in time. “Destruction” = average square miles destroyed by tornadoes. Deaths, injuries, and scale reflect 60 year averages. Count represents how many tornadoes hit the county in the last sixty years. According to the National Atlas data, Jefferson County, Alabama was visited by 70 tornadoes and Jones County, Mississippi was hit by tornadoes 49 times in sixty years. TABLE UPDATED June 2, 2011.
| 1950-2008 TORNADO IMPACT AT COUNTY LEVEL (US) | ||||
| STATE | COUNTY | TORNADO COUNT | CASUALTIES | HISTORIC IMPACT |
| TX | Archer | 27 | 1888 | 100.0 |
| OK | Kay | 81 | 695 | 86.1 |
| MA | Worcester | 33 | 1362 | 85.7 |
| OH | Greene | 14 | 1306 | 84.9 |
| KS | Labette | 31 | 534 | 83.9 |
| NY | Genesee | 36 | 1090 | 81.2 |
| OK | Grady | 53 | 653 | 77.5 |
| IN | Clinton | 13 | 865 | 76.6 |
| MS | Copiah | 32 | 187 | 76.5 |
| SC | Marlboro | 13 | 508 | 76.5 |
| IN | Steuben | 9 | 342 | 76.0 |
| AK | Woodruff | 24 | 546 | 75.8 |
| MS | Jones | 49 | 456 | 75.5 |
| MS | Issaquena | 6 | 855 | 74.1 |
| PE | Clearfield | 6 | 0 | 73.8 |
| GE | Bartow | 14 | 112 | 73.2 |
| NE | Webster | 31 | 8 | 73.0 |
| AL | Jefferson | 70 | 605 | 72.9 |
| IN | Benton | 15 | 306 | 72.9 |
| LO | Franklin | 22 | 568 | 72.2 |
Related articles from Zemanta content network
- Joplin Tornado: Death and Destruction by the Numbers (abcnews.go.com)
- A map of tornado-related fatalities in 2011. (slate.com)
- Amazing satellite photos pinpoint devastation of Joplin, the town wiped off map by deadliest tornado in modern times (usapartisan.com)

Really post, thank you. You might have an increase in functionality if you used Google Fusion Tables http://google.com/fusiontables. It would allow you to create that clickable map by uploading your KML there (up to 100mb).