Please cite: Matei, S. A. (2026). Military Geospatial Data Science: FORCES THOR, OPMAPS, Barbarossa, and South China Sea Maps. Matei.org/I Think Blog.
Military geospatial data science sounds like a technical phrase, and it is. Yet its real job is older and more human: to help a commander, a strategist, a student, or a citizen see how force moves through space, how political ambition takes geographic shape, and how historical decisions can be tested against evidence rather than merely admired or condemned after the fact.
This is why the FORCES Initiative: Strategy, Security, and Social Systems has invested so much attention in military maps, operational data, and spatial analytics. I do not see these projects as decorative visualizations but as digital humanities instruments. They sit between the archive and the future oriented professional military education. They are both classroom aids and the simulation lab. They turn geography into an argument one can inspect.
In an earlier essay on software-centric warfighting, I argued that modern defense development cannot be satisfied with building better hardware and then hoping doctrine will catch up. Platforms matter, but the decisive question is increasingly how data, models, and operators learn together. The FORCES geospatial military analytics portfolio is one answer to that problem. THOR, OPMAPS, Operation Barbarossa by Numbers, and the South China Sea Strategic Assessment all ask a related question: what changes when military history and strategy become queryable, mapped, and empirically testable?
THOR: Turning the strategic bombing campaign into spatial evidence
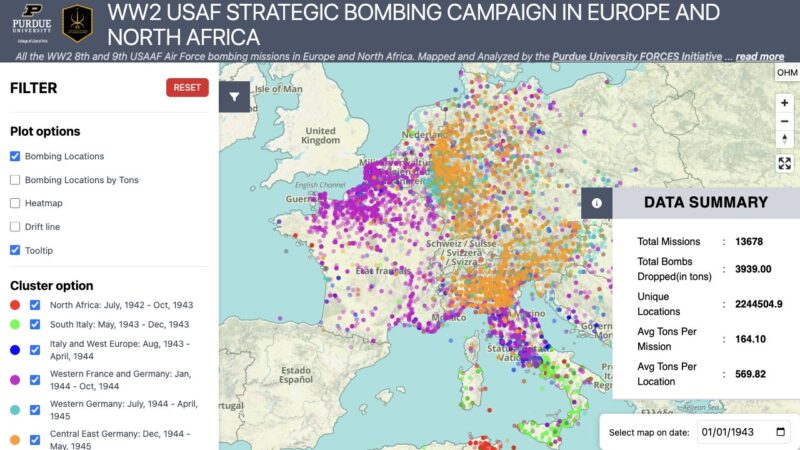
THOR begins with a deceptively simple act: place the U.S. Army Air Forces bombing missions of World War II in Europe and North Africa on a map, then let the data speak in space and time. The project asks whether the campaign was primarily Germany-centric, as a traditional strategic bombing narrative might suggest, or whether operational realities tied the air war more closely to the progress of ground campaigns.
The FORCES THOR analysis uses spatiotemporal clustering to identify where and when missions concentrated. The public project page identifies six strategic clusters, beginning in North Africa, moving through Italy and Western Europe, and only later shifting more heavily toward Germany. This is military history as a hypothesis test. The question is not simply “what happened?” but “does the geography of the campaign support the way we usually explain what happened?”
This is where military geospatial data science becomes intellectually valuable. THOR does not replace narrative history. It disciplines narrative history. It asks the map to show whether our strategic vocabulary matches the operational record.
OPMAPS: Operational maps as data, not wallpaper
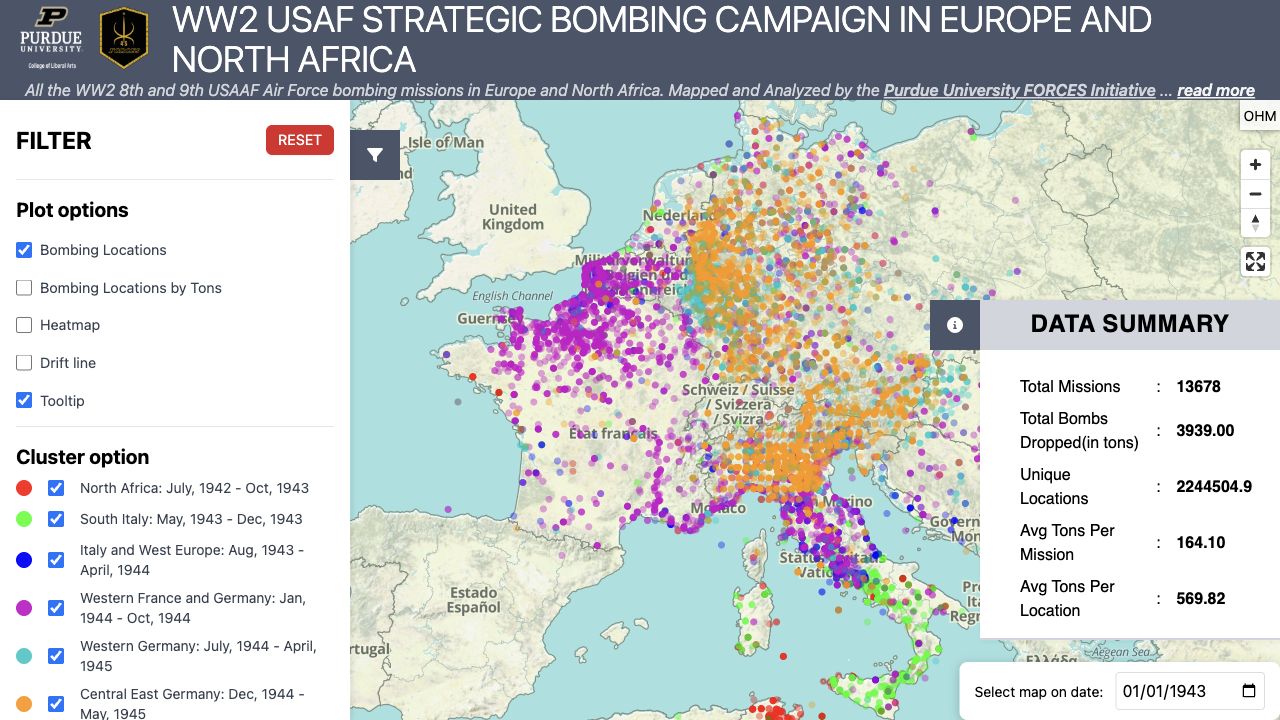
OPMAPS, or Operational Mapping and Analytics, is the broader methodological frame. Its purpose is to digitize historical and contemporary military maps and make them analyzable. That last word matters. A scanned battle map is useful. A queryable battle map is a different kind of instrument.
OPMAPS is designed to show flows of movement, likely axes of attack, likely breakthrough points, the density of opposing forces, and the degree to which an engagement was shaped by mass, maneuver, friction, or missed opportunity. It is also a teaching technology. Military operations often become a blur of arrows in textbooks. OPMAPS slows the arrow down, attaches it to primary and secondary sources, and makes the spatial logic of the battle inspectable.
The collaboration behind OPMAPS also shows what FORCES does well: bring together spatial social statistics, military history, data visualization, and defense education. Strategy is too important to be left to either the purely verbal essay or the purely technical model. We need both. OPMAPS is one of those middle spaces where the model, the map, and the historical question meet.

Barbarossa: What a campaign looks like when the archive is counted
The Barbarossa work is a good example of how one data project gives birth to another. While working with operational maps, FORCES researchers encountered archival material that opened a different path into the German campaign in the East. The German Casualty Project focuses on officer casualty reports from Army Group Center between June 22 and September 10, 1941. The source base includes thirteen periodic personnel reports, roughly 250 pages, more than 5,000 individuals, and tens of thousands of data points once names, ranks, units, positions, dates, and casualty categories are coded.
That sounds granular because it is. But granularity is the point. Barbarossa is often narrated at continental scale: arrows toward Moscow, vast encirclements, sweeping operational ambition. The FORCES approach also asks what the campaign looked like at the level of officer losses, unit stress, uneven casualties, and organizational brittleness. A battle can look elegant on a wall map and brutal in a personnel ledger. Strategy needs both views.
The OPMAPS Battle for Smolensk view adds another layer. It shows movement and resistance in the July to September 1941 campaign, making visible how the Soviet defense stiffened and how German movement slowed. The map is not merely about where units were. It is about momentum, density, delay, and cost.
South China Sea: Flashpoint maps for future conflict analysis
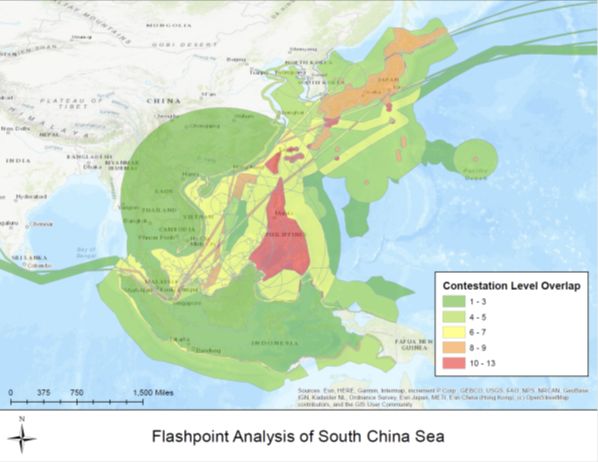
If THOR and Barbarossa show how military geospatial data science can reinterpret the past, the South China Sea Strategic Assessment shows how the same habit of mind can help us reason about future conflict. The project analyzes flashpoints by layering territorial claims, counter-claims, military power projection, shipping and telecommunication routes, fishing grounds, and natural resource areas.
The result is not a prophecy. Maps should never be confused with fate. It is a structured way to make assumptions visible. The FORCES assessment highlights the Malacca Strait, Taiwan, and the Philippines as especially significant areas of concern. One can debate the weights. One can add layers. One can change assumptions. That is precisely the value of the model. A good strategic map invites disciplined argument rather than free-floating speculation.
From maps to military science
The common denominator across these projects is not simply that they are maps. It is that they treat military geography as data and military data as a social-technical system. The data are gathered by people, recorded by institutions, distorted by fog and friction, interpreted through theory, and finally made operational through tools. This is why FORCES belongs at the intersection of strategy, security, and social systems.
There is a temptation in defense technology to think of data as a magic solvent. Add data, and the hard choices dissolve. Anyone who has worked seriously with historical or strategic data knows the opposite is true. Data create better questions. They reveal that some of our favorite explanations are too neat. They show that operational reality is not a line, but a field of pressures, constraints, timing, terrain, and human judgment.
That is the point of these FORCES tools. THOR asks whether the bombing campaign went where strategy said it should go. OPMAPS asks whether battle movement can be made queryable. Barbarossa asks how archival casualty evidence changes the story of momentum and exhaustion. The South China Sea Strategic Assessment asks where overlapping claims and capabilities create dangerous strategic geometry.
In each case, the map is not an illustration after the argument is finished. The map is part of the argument. It is where evidence becomes visible enough to be challenged.
Project links
- FORCES Initiative: Strategy, Security, and Social Systems
- THOR project description and THOR interactive bombing campaign explorer
- OPMAPS interactive operational mapping project
- WWII Operation Barbarossa By Numbers
- South China Sea Strategic Assessment
- BattleFlow continuous-flow military operations model and the peer-reviewed BattleFlow paper